Loading Gradenest...
Academic Analytics
Data-Driven Decisions for Academic Excellence.
Transform raw academic data into actionable insights. Gradenest Analytics provides interactive dashboards, performance trends, predictive indicators, and AI-powered recommendations.
What is Academic Analytics?
Academic Analytics provides school leaders with visual dashboards and reports that surface performance trends, identify at-risk students, compare class and subject outcomes, and deliver AI-powered recommendations for improvement.
Who is it for?
Principals, academic coordinators, heads of department, and data-minded administrators.
Why it matters
Schools that use data to drive decisions consistently outperform those that rely on intuition. Analytics transforms scattered grade data into a strategic asset.
Key Benefits
Here is how this module helps optimize your daily administrative workflow.
Real-Time Dashboards
Live overview of school-wide academic performance.
Trend Analysis
Track performance trends across terms, sessions, and years.
Risk Detection
AI identifies students at risk of academic failure.
Comparative Analytics
Compare performance across classes, subjects, and departments.
AI Recommendations
Intelligent suggestions for academic interventions.
Report Export
Export analytics reports in PDF and Excel for board meetings.
Product Capabilities
Built specifically to address the academic needs of modern schools.
School Dashboard
School-wide KPIs including pass rates, averages, and enrollment metrics.
Performance Trends
Interactive line charts showing academic trends over multiple periods.
Student-Level Drill-Down
Click into any metric to see individual student data.
Predictive Indicators
AI-powered predictions for end-of-term and end-of-year outcomes.
Custom Filters
Filter analytics by class, subject, department, gender, or custom criteria.
Board Reports
Pre-formatted reports suitable for board meetings and stakeholder presentations.
How It Works
A simple, automated workflow that takes you from raw data to actionable results.
Step 1
Data Collection
Academic data flows automatically from result processing, attendance, and enrollment modules.
Step 2
Analysis
The analytics engine processes data and surfaces key metrics, trends, and anomalies.
Step 3
Visualization
Interactive dashboards present data in charts, graphs, and tables.
Step 4
Action
Use insights to make data-driven decisions and targeted interventions.
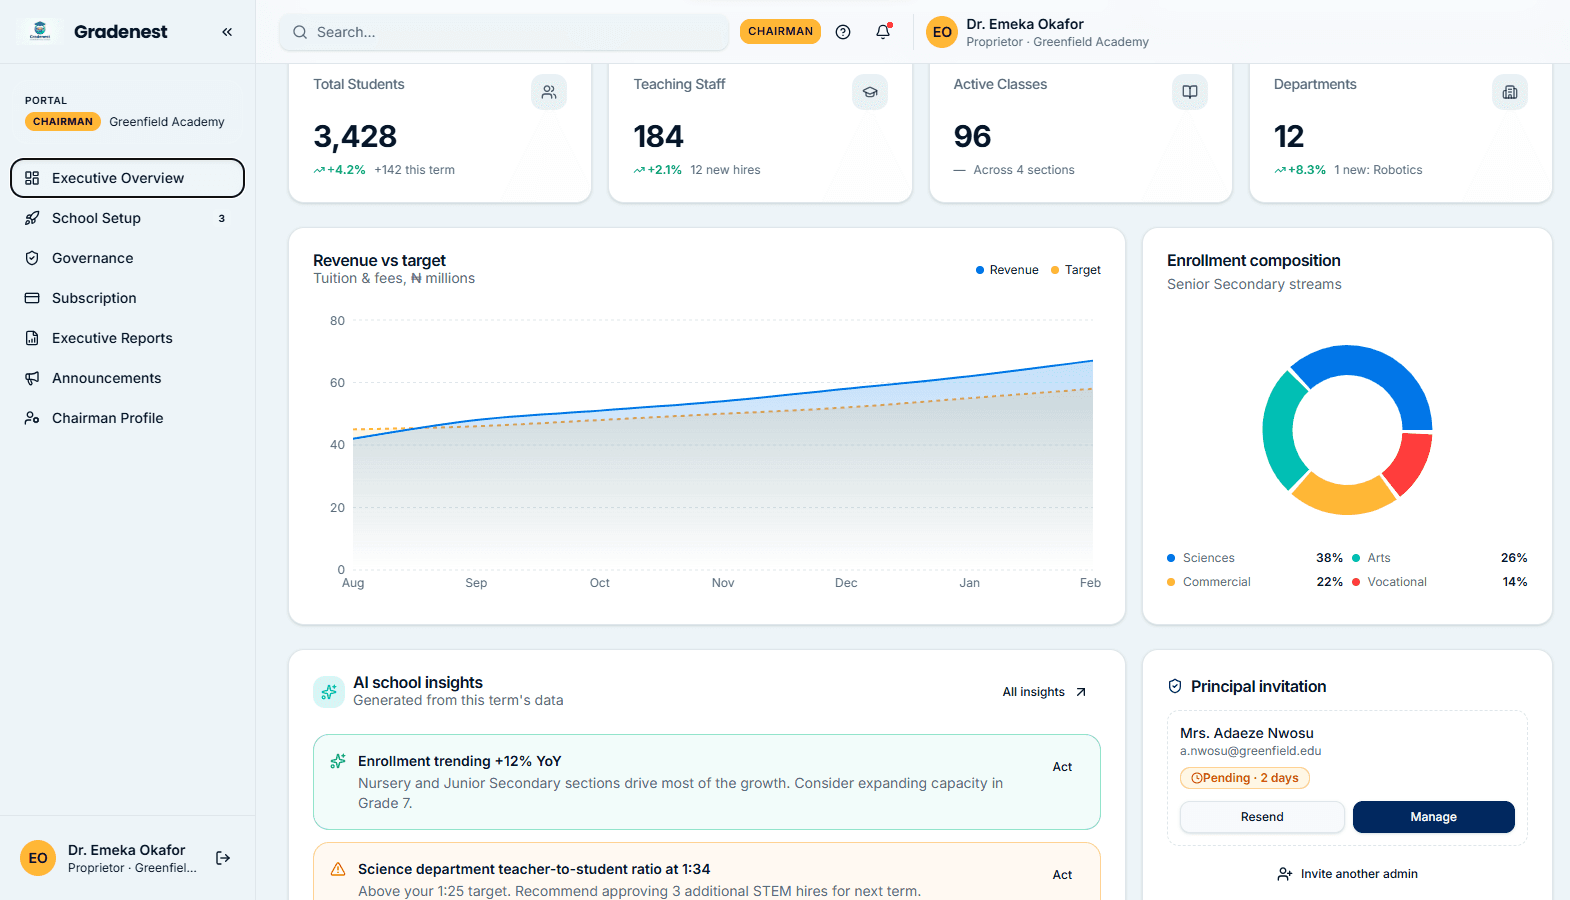
Academic Analytics Interface
Take a tour of the clean, modern layout designed for academic analytics.
Frequently Asked Questions
Everything you need to know about this module.
Yes. Analytics dashboards reflect data as it's entered and processed — no manual refresh required.
Yes. With Multi-Campus Management, analytics can compare performance across different branches.
Yes. Reports can be exported in PDF and Excel formats, pre-formatted for professional presentations.
Yes. The AI engine uses historical data to forecast future performance and flag students who may need intervention.
Related Modules & Capabilities
Ready to Transform Your School?
Join hundreds of schools already using Gradenest to save time, eliminate errors, and improve academic outcomes.