Loading Gradenest...
Operational Challenge
Transform Raw Grades into Actionable Insights.
Analyze class averages, track subject performance trends, identify students needing support, and run school-wide statistics from a visual dashboard.
Guide School Decisions with Academic Data
Academic data is often scattered across paper sheets, spreadsheets, and portals. Gradenest compiles these details into interactive dashboards, making it easy to track class averages, compare streams, and monitor student outcomes.
Who is it for?
Principal, Chairman & Proprietor, Vice Principal, HODs
Solving Key Challenges for Academic Analytics
Here is how Gradenest eliminates operational roadblocks and drives efficiency.
The Challenge
No real-time way to compare academic performance across classes or subjects.
The Gradenest Solution Comparative Dashboard
Visual comparison tables showing pass rates, averages, and grades across sections.
The Challenge
Missing early warning signs of declining student grades.
The Gradenest Solution Declining Grade Tracker
Identifies students whose averages have dropped compared to previous terms.
The Challenge
Spending hours calculating stats and averages for board presentations.
The Gradenest Solution Pre-Formatted Board Reports
Download and print clean PDF summaries of overall school academic performance.
Solution Capabilities
Explore the customized tools and integrations engineered for this solution.
School-Wide KPIs
View enrollment trends, overall averages, and pass/fail metrics at-a-glance.
Subject Average Auditing
Identify subjects with high failure rates or significant grade differences.
Student-Level Drilldown
Click into any metric to view individual student profiles and performance histories.
Platform Integrations
Learn how Gradenest products and AI features power this solution.
Core Modules
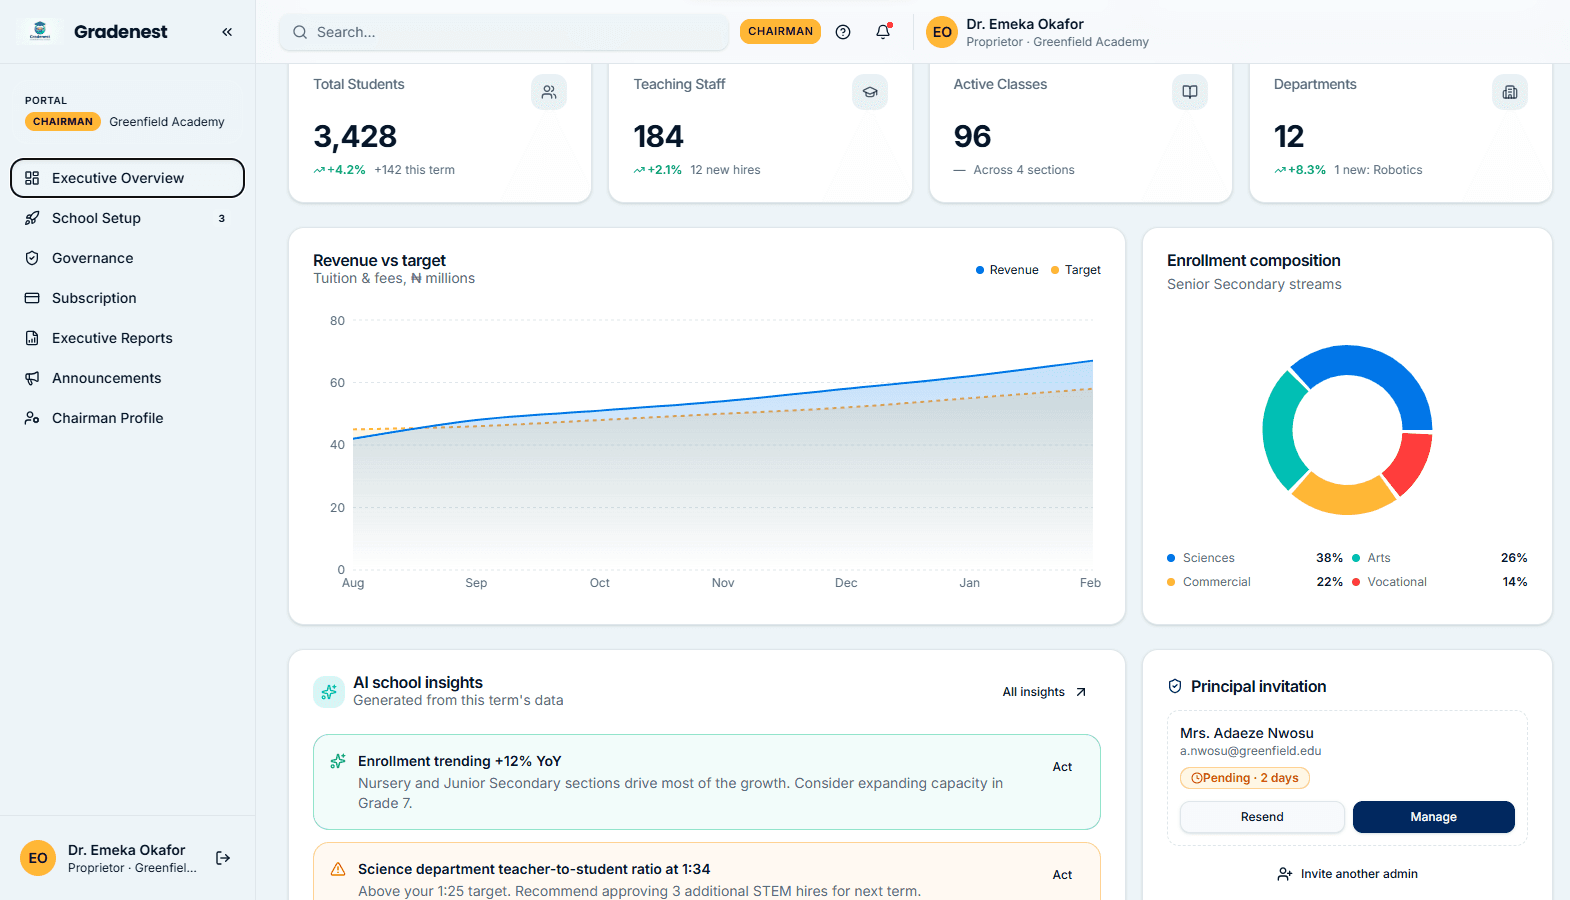
Academic Analytics Experience
Take a tour of the premium, intuitive dashboards configured for academic analytics.
Implementation Workflow
Our step-by-step path to deploy this solution successfully at your school.
Step 1
Open Analytics Portal
Log in and select your campus branch or class stream.
Step 2
Review Performance Metrics
Track subject averages, class pass rates, and grade trends.
Step 3
Identify Academic Risks
Check flagged lists for students requiring intervention.
Strategic Benefits
The tangible outcomes and administrative advantages of adopting Gradenest.
Performance Insight
Identify which classes and subjects are excelling or falling behind.
Targeted Support
Flag students needing academic help early in the term.
Board-Ready Reports
Download pre-formatted reports for board meetings and reviews.
Measurable Impact
Gradenest by the Numbers
99.9%
Calculation Accuracy
Precision averages, rankings, and GPAs calculated instantly.
100%
Real-Time Tracking
Dashboards update immediately as gradebooks are locked.
"Gradenest solved our oversight bottleneck. I can see which branches are submitting grades on time and compare pass rates across our group from my phone."
Chief Dr. Kolawole Davies
Chairman, Davies Group of Schools
Verified Case Study
Frequently Asked Questions
Everything you need to know about this solution.
Yes, analytics dashboards update immediately as grades and attendance are recorded.
Yes, you can print reports or download raw CSV data for custom analytics tools.
Related Solutions
Explore other Gradenest templates configured for similar requirements.
Chairman & Proprietor
Executive-level dashboard visibility, operational health tracking, and group-wide analytics.
Principal
School-wide academic oversight, teacher grading progress monitoring, and result approval workflows.
AI School Insights
Predictive student analytics, automated risk flags, and context-aware recommendation reports.
Ready to Transform Your School?
Join hundreds of schools already using Gradenest to save time, eliminate errors, and improve academic outcomes.